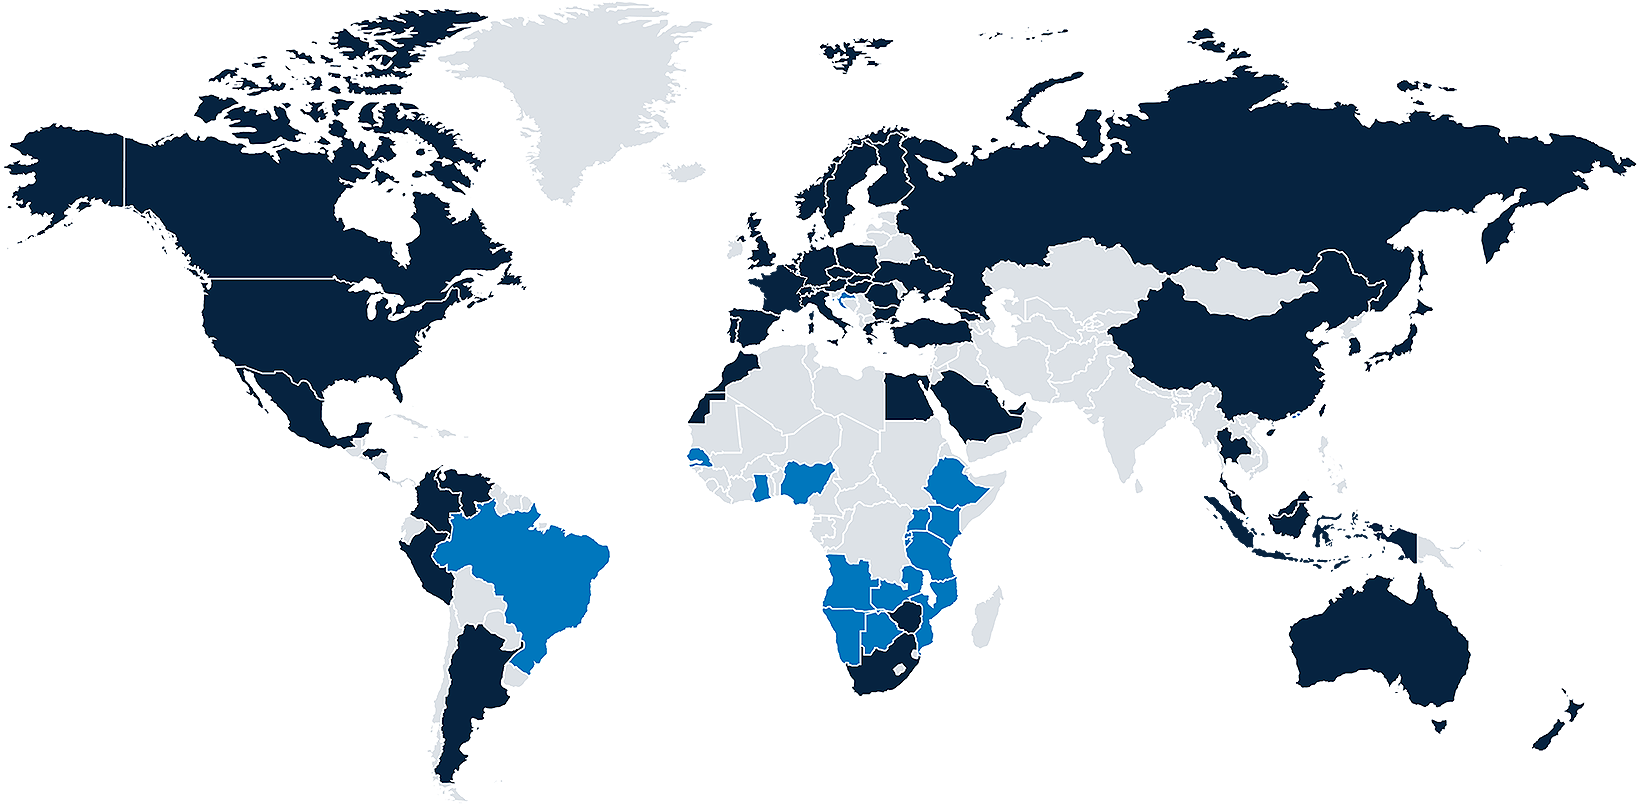
Low Volume
High Volume
Source: Source: DLA Piper global firmwide activity, Q1 2019 – Q1 2020
Grey coloured areas indicate reliable data is not (yet) available for this country.
Grey coloured areas indicate reliable data is not (yet) available for this country.
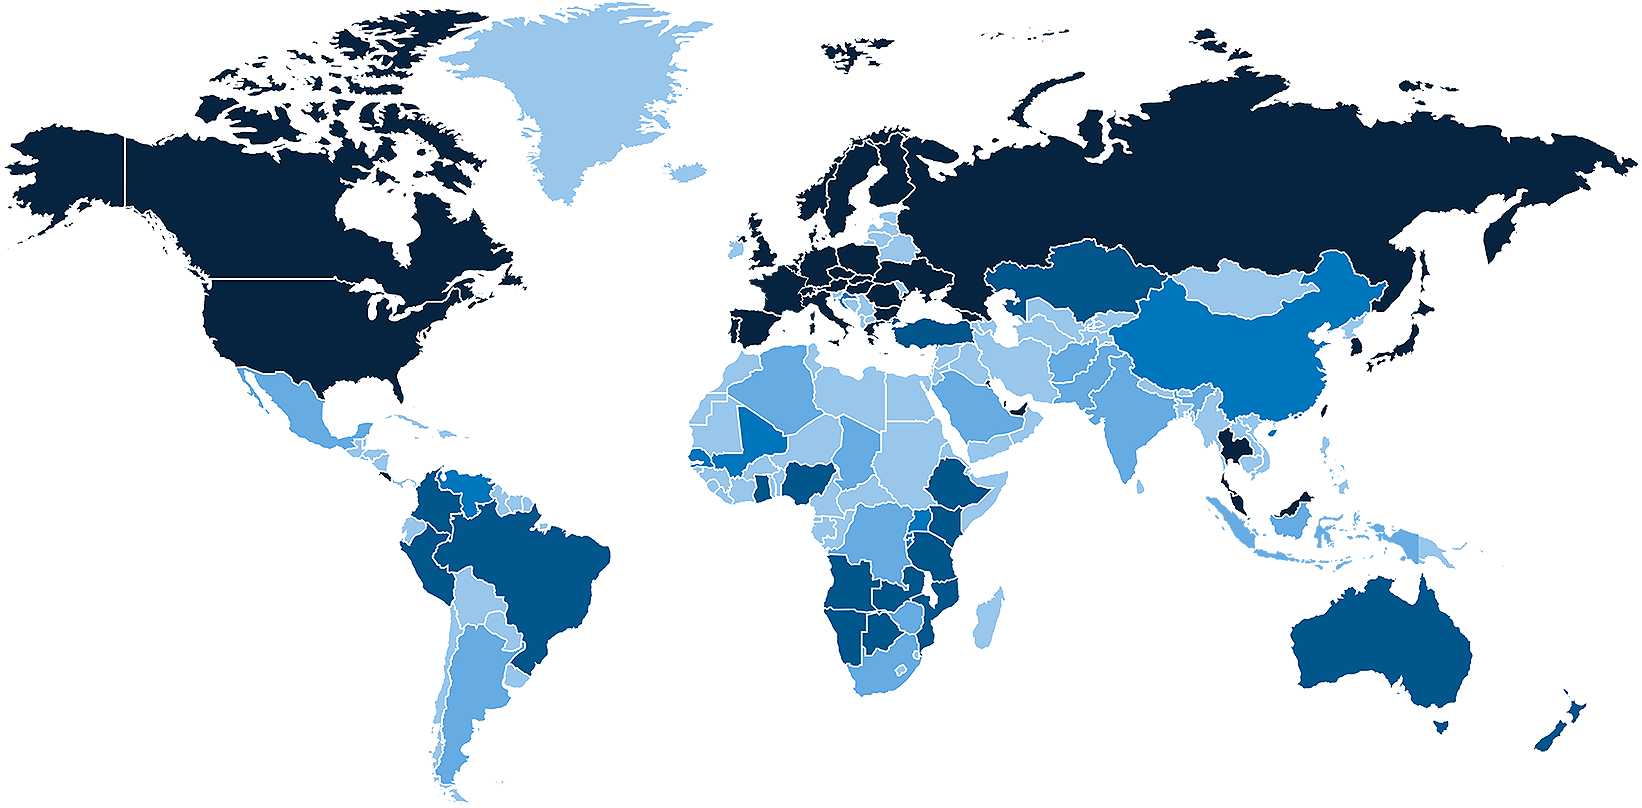
Low
High
Source: IMF - COVID-19 response by national government (cumulative spend, US$). April 2020
Grey coloured areas indicate reliable data is not (yet) available for this country.
Read more in our global overview and supporting business guide and on FinBrief: The global economy in 2020
Grey coloured areas indicate reliable data is not (yet) available for this country.
Read more in our global overview and supporting business guide and on FinBrief: The global economy in 2020
Low Volume
High Volume
Source: Digital Asset Network (assetnetwork.com) – Digital Asset Ecosystem Macro Report
This map represents the number of STOs that have raised funds or disclosed info in 2019 and in Q1 2020.
Grey coloured areas indicate reliable data is not (yet) available for this country.
This map represents the number of STOs that have raised funds or disclosed info in 2019 and in Q1 2020.
Grey coloured areas indicate reliable data is not (yet) available for this country.